What Thrift Store Items Should Be Sold Online vs. In Store?
October 21, 2026
The 7 Numbers Every Thrift Store Operator Should Know
Thrift stores generate a lot of data. The challenge is knowing which numbers actually matter to help support the mission.
Traditional retailers focus heavily on sales, margin, and inventory. Thrift operators need those same factors, but they also have to understand how efficiently donated goods are processed, priced, moved to the sales floor, and sold.
That makes thrift performance harder to measure with generic retail metrics alone.
We’ll break down seven KPIs every thrift operator should understand, what each one tells you, and where to look when the numbers start moving in the wrong direction. We’ll also look at why connecting POS, inventory, and operational data gives leaders a clearer picture of overall performance.
7 Numbers Every Thrift Operator Should Know
Swipe to see all seven numbers →
The Difference Between Retail KPIs and Thrift Store KPIs
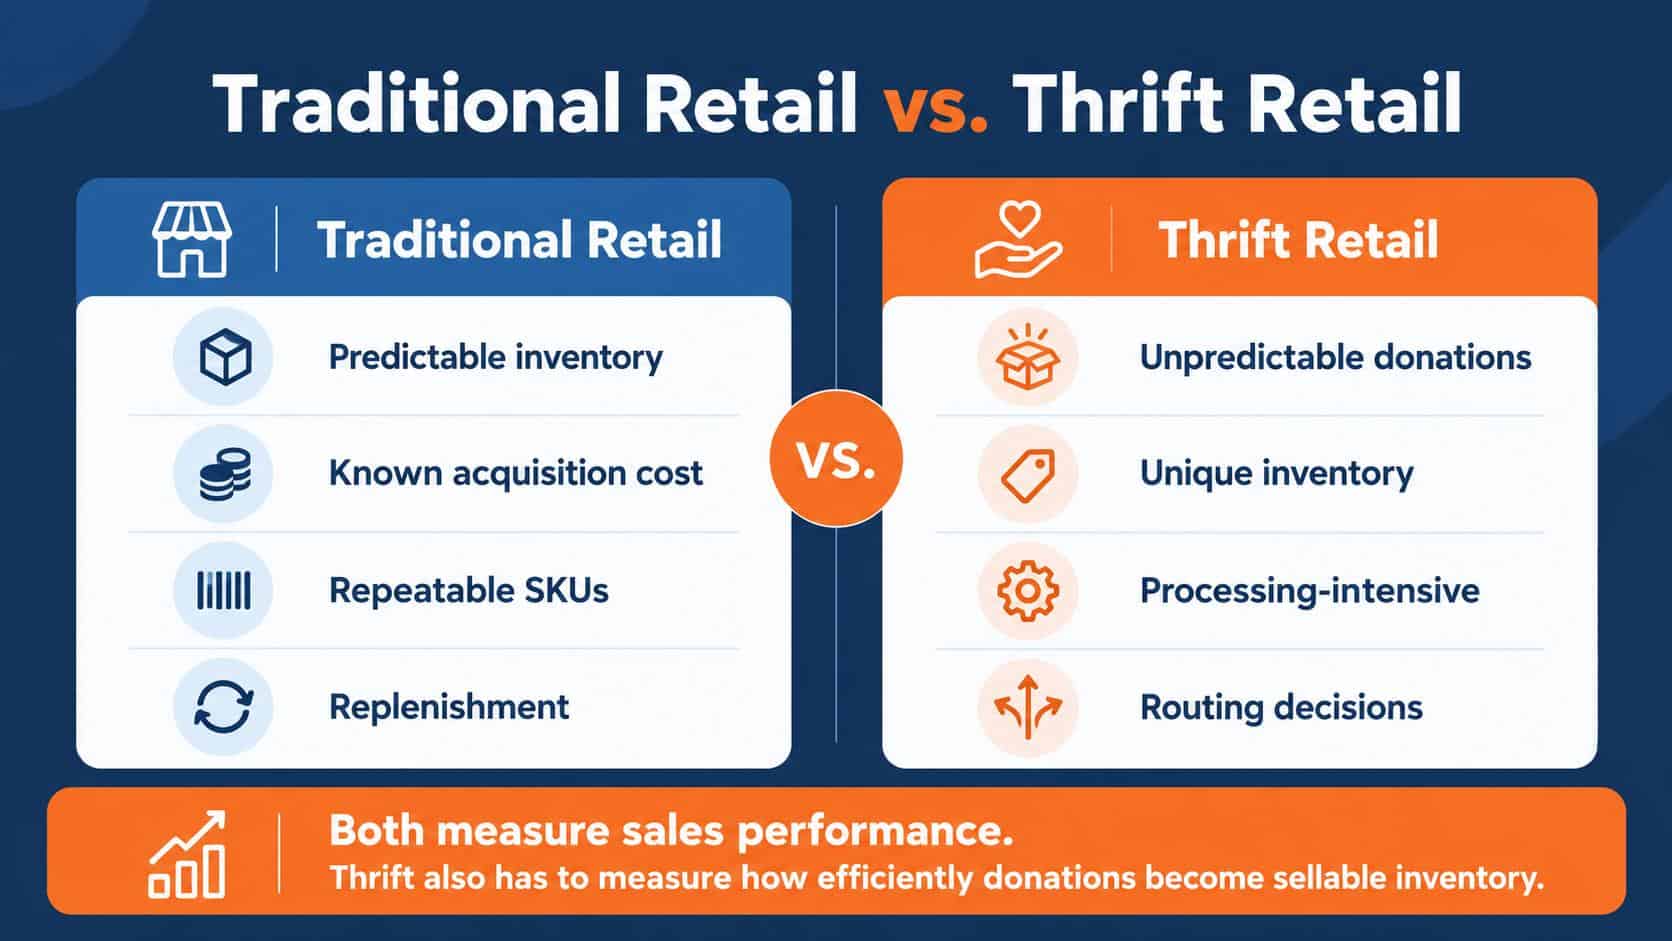
Traditional retailers generally know what inventory is arriving, how much it costs, and how many units are available. Their performance metrics often center on merchandise cost, sales, margin, inventory turnover, and replenishment.
Thrift operations work differently.
Donated inventory arrives almost unpredictably, and nearly every item can require a different decision. Teams need to sort, identify, price, process, and route merchandise before it can generate revenue.
That means thrift operators need to measure more than what happens at checkout. They also need visibility into how efficiently inventory moves from donation intake to sale.
Traditional retail and thrift share metrics like sales, margin, and transaction value. But thrift organizations also need to understand processing productivity, sell-through, inventory aging, markdowns, and the labor required to turn donated goods into sellable inventory.
What Thrift Store KPIs Matter Most?
For thrift operators, backroom efficiency and sales-floor performance are connected.
If merchandise takes too long to process, gets priced incorrectly, or reaches the wrong sales channel, those decisions can affect labor costs, inventory flow, sell-through, and ultimately revenue.
These seven KPIs provide a useful starting point for understanding both sides of the operation.
1. Gross Profit Margin (GPM)
Gross Profit Margin measures the percentage of sales revenue remaining after cost of goods sold.
GPM = (Net Sales − COGS) ÷ Net Sales × 100
For thrift organizations, this metric requires some context. Donated merchandise generally does not carry the same inventory acquisition costs as merchandise purchased by a traditional retailer. However, thrift stores still incur significant costs to receive, process, price, merchandise, and sell those donations.
GPM is useful for understanding gross profitability, but it does not show the full cost of running the operation. Expenses such as rent, utilities, many labor costs, and other operating expenses are typically measured elsewhere.
A changing margin should therefore be viewed alongside metrics like labor productivity, sell-through, inventory aging, and markdowns rather than interpreted on its own.
2. Average Transaction Value (ATV)
Average Transaction Value measures how much the average customer spends each time they check out.
ATV = Net Sales ÷ Total Transactions
You can track ATV by day, week, month, store, or other reporting period to understand how customer spending changes over time.
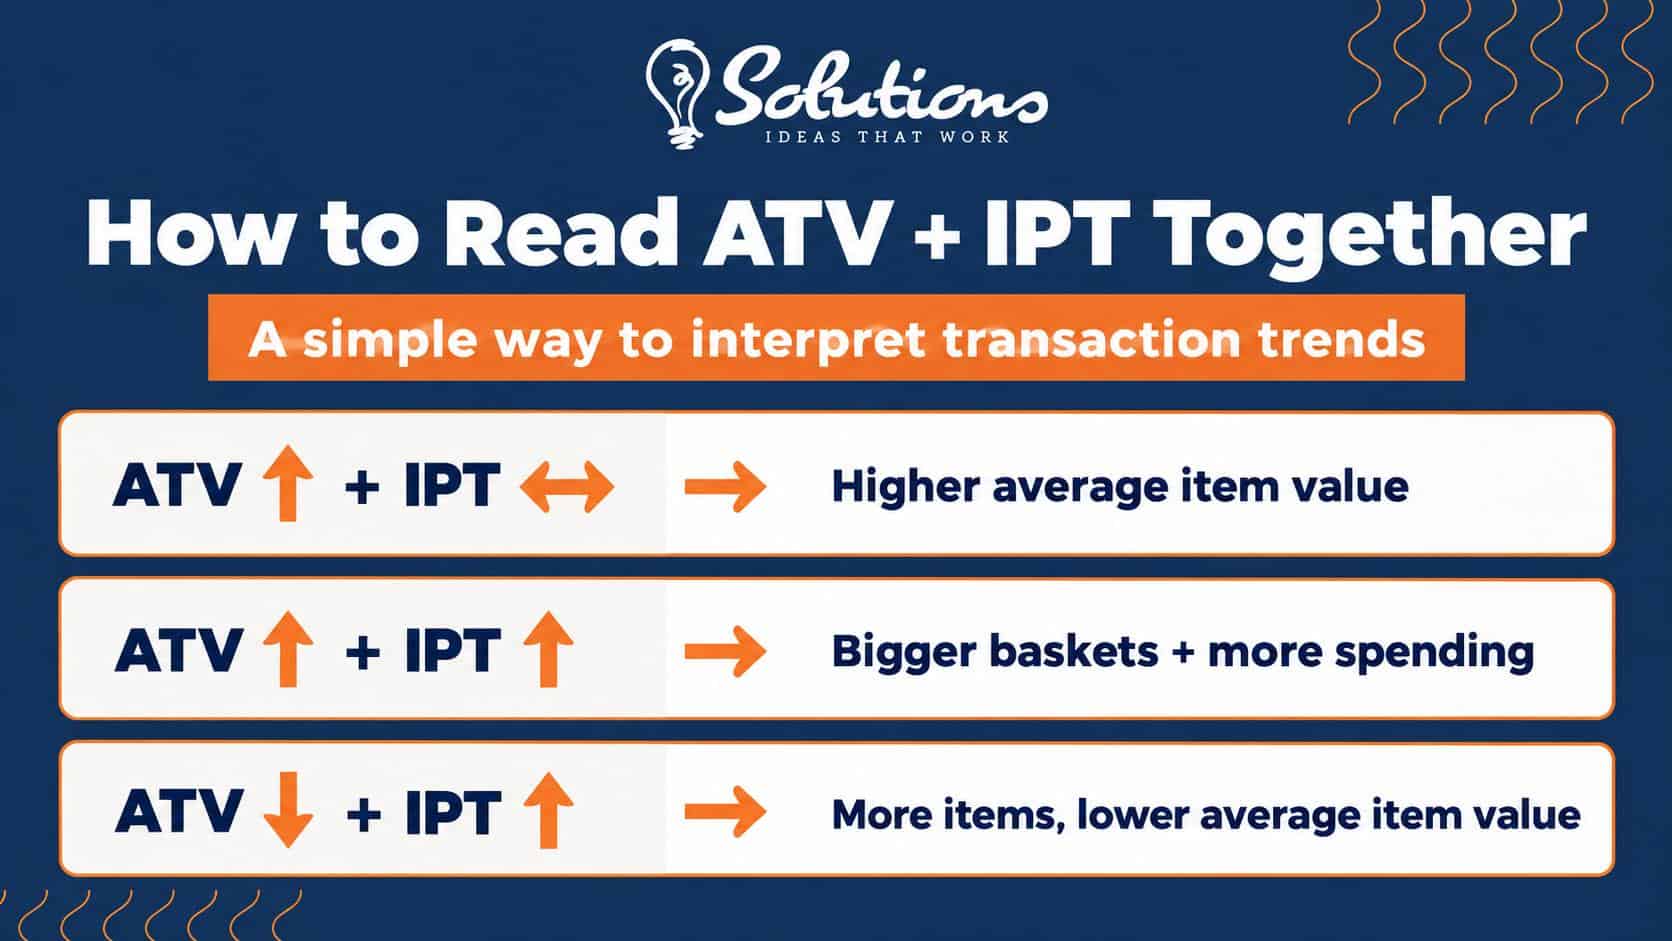
ATV is especially useful when viewed alongside Items Per Transaction (IPT). If ATV increases while IPT stays flat, customers may be purchasing higher-priced merchandise. If both ATV and IPT rise, customers are buying more items and spending more per visit.
But higher isn’t automatically better. Changes in ATV can reflect pricing, promotions, merchandise mix, seasonality, or shifts in what customers are buying.
The most useful question is never simply, “Is ATV going up?” It’s “What is causing it to change?”
If ATV starts moving unexpectedly, compare it with IPT, transaction volume, category sales, and your pricing strategy to understand why.
3. Items Per Transaction (IPT)
Items Per Transaction measures the average number of items customers purchase each time they check out.
IPT = Total Units Sold ÷ Total Transactions
Also called basket size, IPT helps operators understand whether customers are buying more or fewer items per visit.
On its own, however, IPT doesn’t tell you whether those larger baskets are generating more revenue. That’s why it’s most useful when viewed alongside Average Transaction Value (ATV).
If IPT and ATV both increase, customers are buying more items and spending more. If IPT rises while ATV falls, customers may simply be purchasing more lower-priced or discounted merchandise.
Changes in IPT can be influenced by merchandise mix, pricing, promotions, store layout, impulse purchases, and inventory availability.
The goal is a basket that supports healthy revenue and margin.
4. Sales Per Labor Hour (SPLH)
Sales Per Labor Hour measures how much sales revenue is generated for each hour of labor worked.
SPLH = Net Sales ÷ Labor Hours
SPLH helps operators compare staffing levels with revenue and identify changes in labor productivity over time. It can be measured across the entire store or, when the data is available, by department or function.
Because sales and staffing fluctuate throughout the week, SPLH is most useful as a trend rather than a single hourly snapshot.
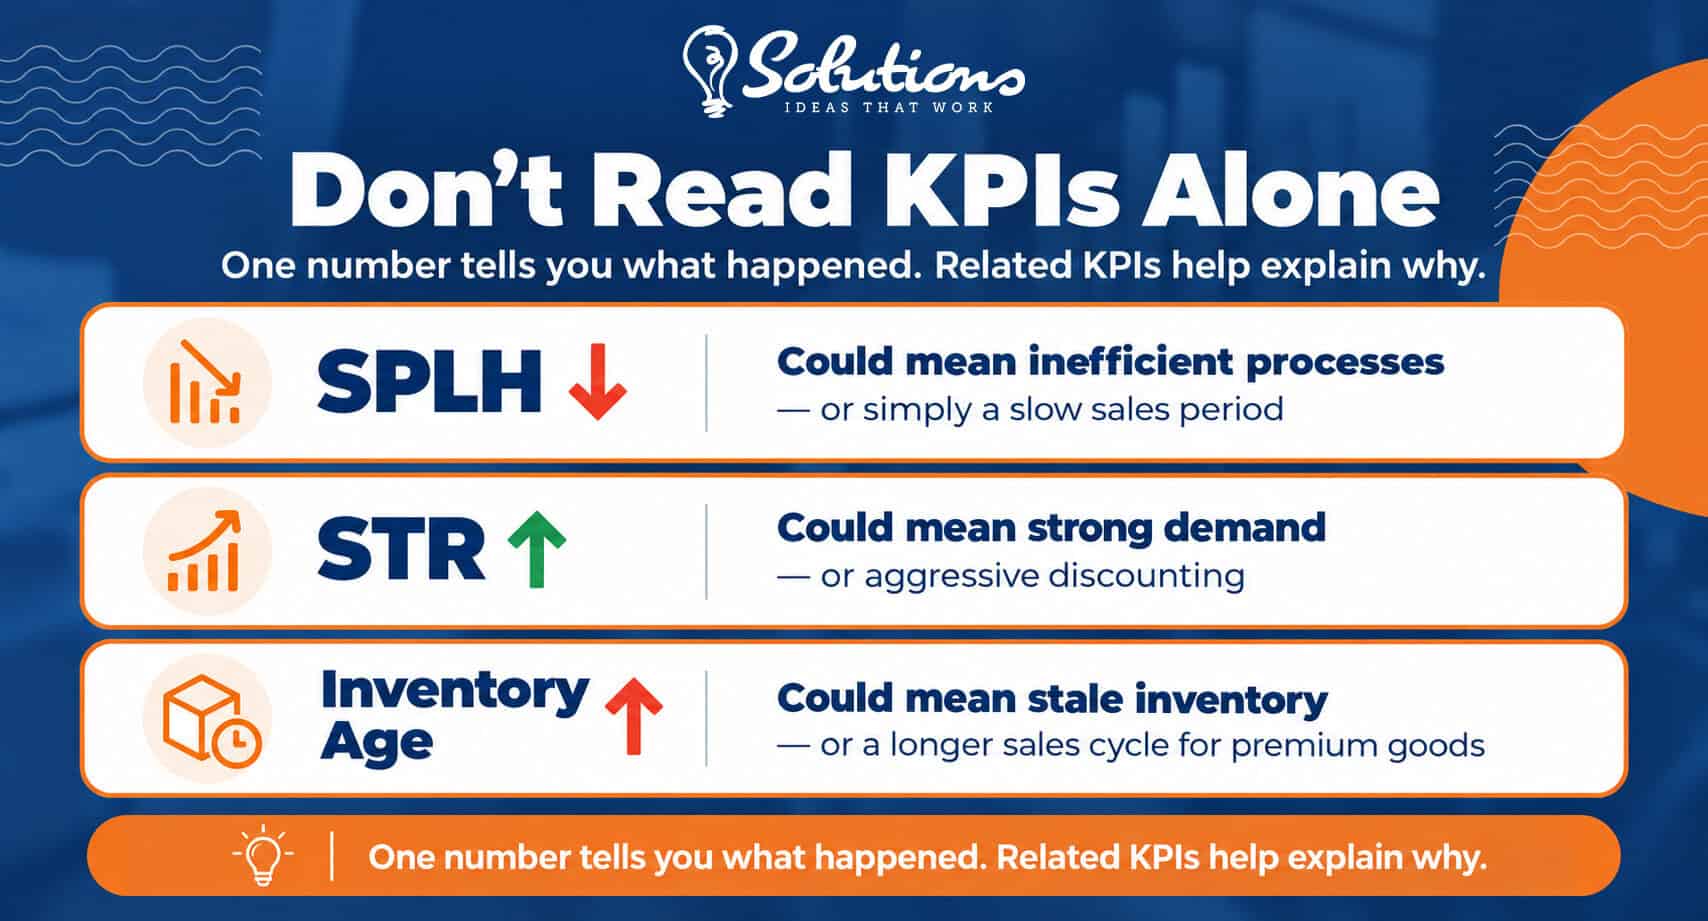
A lower SPLH might point to overstaffing, weak sales, scheduling issues, or inefficient processes. But the number alone won’t tell you where the problem is.
That’s why thrift operators should look beyond total SPLH when possible. Separating processing, retail, and other labor can help identify where employee time is actually creating or constraining value.
5. Sell-Through Rate (STR)
Sell-Through Rate measures how much available inventory sells during a defined period.
STR = Units Sold ÷ Units Available for Sale × 100
Thrift organizations may also compare units sold with units processed during a defined period. Whichever method you use, the important thing is applying the same definition consistently so performance can be compared across stores, categories, and time periods.
STR helps answer a fundamental question:
Are the items we’re putting into this sales channel actually selling?
A lower sell-through rate can signal pricing issues, weak demand, poor merchandise selection, or inventory being routed to the wrong channel. A higher STR generally indicates stronger movement, but it should still be viewed alongside selling price and margin.
Selling everything quickly at deep discounts isn’t necessarily better than selling slightly fewer items at stronger prices.
That makes STR especially useful alongside pricing, markdown, and channel-routing decisions.
6. Inventory Aging
Inventory Aging measures how long merchandise remains unsold after it becomes available for sale.
Operators can track inventory age by store, category, price point, or sales channel to identify where merchandise is moving quickly and where it may be getting stuck.
In general, growing inventory age can indicate weak demand, pricing problems, poor placement, or too much inventory in a particular category. It can also lead to additional markdowns and consume valuable selling space.
But lower isn’t automatically better.
A high-value specialty item may reasonably take longer to sell than an everyday piece of clothing. That’s why aging becomes much more useful when it’s segmented by category, value, and sales channel rather than viewed only as one store-wide average.
The goal is not simply to sell everything faster. It’s to understand whether each type of inventory is moving at the pace you expect.
7. Markdown Percentage
Markdown Percentage measures how much original selling price is reduced through discounts, color-tag sales, category promotions, clearance, or other markdowns.
Markdown % = Markdown Value ÷ Original Retail Value × 100
Markdowns are a normal part of thrift retail. They help keep merchandise moving, free up selling space, and create room for new donations.
But when markdown percentage rises over time, it can be a useful signal that something upstream deserves attention.
Higher markdowns may point to:
- Initial prices that are too high
- Slower-moving categories
- Weak demand
- Aging inventory
- Too much merchandise entering the same sales channel
Markdown percentage is most useful when viewed alongside sell-through, inventory aging, and category performance.
The goal is to understand whether they’re part of a healthy inventory strategy or compensating for a problem elsewhere.
| KPI | Definition | Basic Formula | What It Tells You |
|---|---|---|---|
| GPM — Gross Profit Margin | The percentage of sales revenue remaining after direct cost of goods sold. | (Net Sales − COGS) ÷ Net Sales × 100 | How much gross profit the operation generates from sales before operating expenses. |
| ATV — Average Transaction Value | The average amount a customer spends each time they check out. | Net Sales ÷ Transactions | Whether customers are spending more or less per visit. |
| IPT — Items Per Transaction | The average number of items purchased in each transaction. | Units Sold ÷ Transactions | How many items customers typically put in their basket. |
| SPLH — Sales Per Labor Hour | The amount of sales revenue generated for each labor hour worked. | Net Sales ÷ Labor Hours | How effectively staffing levels are supporting revenue. |
| STR — Sell-Through Rate | The percentage of available or processed inventory that sells during a defined period. | Units Sold ÷ Units Available/Processed × 100 | How effectively inventory is matching demand and moving through the operation. |
| Inventory Aging | The amount of time inventory remains available before selling, being marked down, or leaving the primary sales channel. | Typically measured as days since processing/pricing | How quickly merchandise is moving and where inventory may be getting stuck. |
| Markdown % | The percentage of original retail value reduced through discounts, tag sales, clearance, or other markdowns. | Markdown Value ÷ Original Retail Value × 100 | How much pricing is being reduced to keep inventory moving. |
How to Measure Thrift Store Performance from POS and Inventory Data
POS and inventory data can tell you a lot about what happens on the sales floor: what sold, for how much, how quickly, and at which location.
But those numbers become more useful when you can connect them to what happened earlier in the process.
How much labor went into processing the inventory? Which categories are aging? Where are markdowns increasing? Which items are being routed to retail versus e-commerce?
That broader operational context helps explain why a KPI is changing. Not just that it changed.
Solutions DGR brings retail, inventory, and production data together through reporting and analytics built for thrift operations. And as organizations connect those insights with backroom and e-commerce workflows, leaders can get a clearer view of how decisions made at intake and processing ultimately affect sales performance.
Instead of adding more dashboards, this provides better visibility into how the entire operation is performing.
Learn more about connecting your thrift operations in our 2026 Thrift Trends Guide.
Frequently Asked Questions
What thrift store KPIs are relevant?
Thrift stores rely on a variety of metrics to measure process efficiency and pricing/layout effectiveness. Key thrift performance indicators include gross profit margin, average transaction value, items per transaction, sales per labor hour, sell-through rate, inventory aging, and markdown percentage.
What is the difference between retail KPIs and thrift store KPIs?
Because thrift stores sell a variety of different goods every day, they have more labor costs and less opportunity to rely on large amounts of standardized goods. Thrift store KPIs reflect these different operational needs.
How to measure thrift store performance from POS and inventory data?
POS and thrift store inventory data let managers understand how quickly goods are processed and sold. It should be combined with data from all areas of the thrift operation to give a complete overview of the business’ efficiency and health.